

Hello everyone,In this blog we are going to see about Scatter plots in python.We are going to use “MATPLOTLIB” and “SEABORN” to draw scatterplots.
So what is a Scatter plot?
There are various types of graphs and charts in python we use for visualisations.Scatterplot is one kind of the graph,which looks like a Github activity timeline.These graphs does not have lines between the points,they only have the markers marked down.
So first we will import the Seaborn library.And also for an example we are going to use one of the pre-built datasets available in the Seaborn library called “iris”.
import matplotlib.pyplot as plt
import seaborn as sns

flowers=sns.load_dataset("iris")
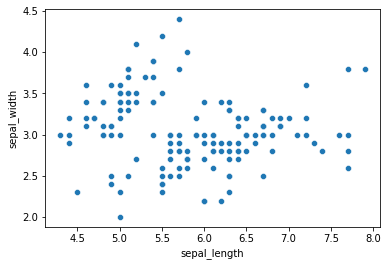
This dataset has various columns,we are going to plot the “sepal_length” column and “sepal_width” column in the scatter plot using seaborn.
sns.scatterplot(flowers.sepal_length,flowers.sepal_width)

//can also specify it like

sns.scatterplot('sepal_length','sepal_width',data=flowers)

Both will work as same
This will produce an output like,
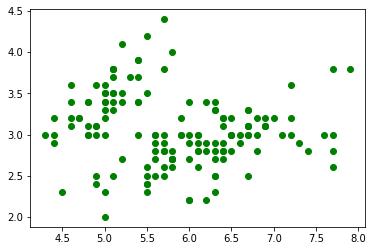
MATPLOTLIB also have a scatterplot,but it is not as much as customisable like Seaborn.So instead of the above Seaborn command we can use
plt.plot(flowers.sepal_length,flowers.sepal_width,'og')
This will also gives a scatterplot like
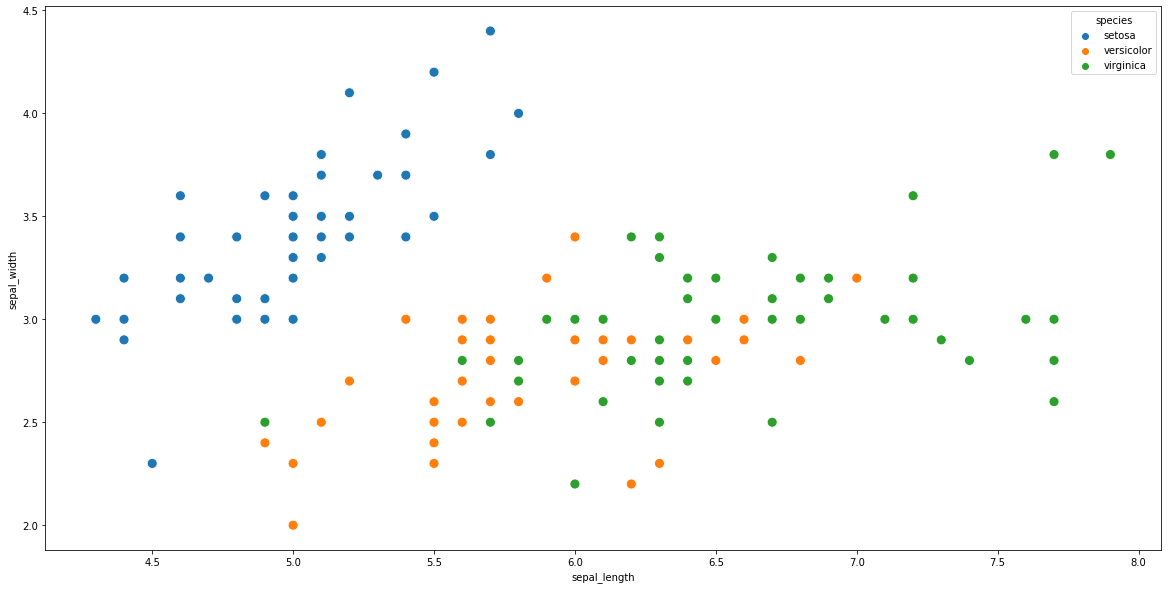
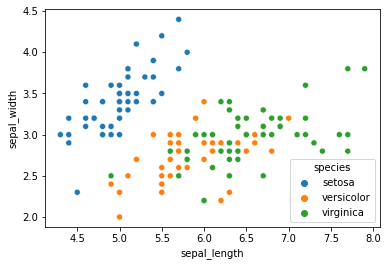
Since now,there is no difference in the graph points.So it is not possible to see if there is any connection between the columns.So for that we can specify another column name in the parameter using the “hue” method.This will separate the column based on this new columns.
sns.scatterplot(flowers.sepal_length,flowers.sepal_width,hue=flowers.species);
This will give an output like,
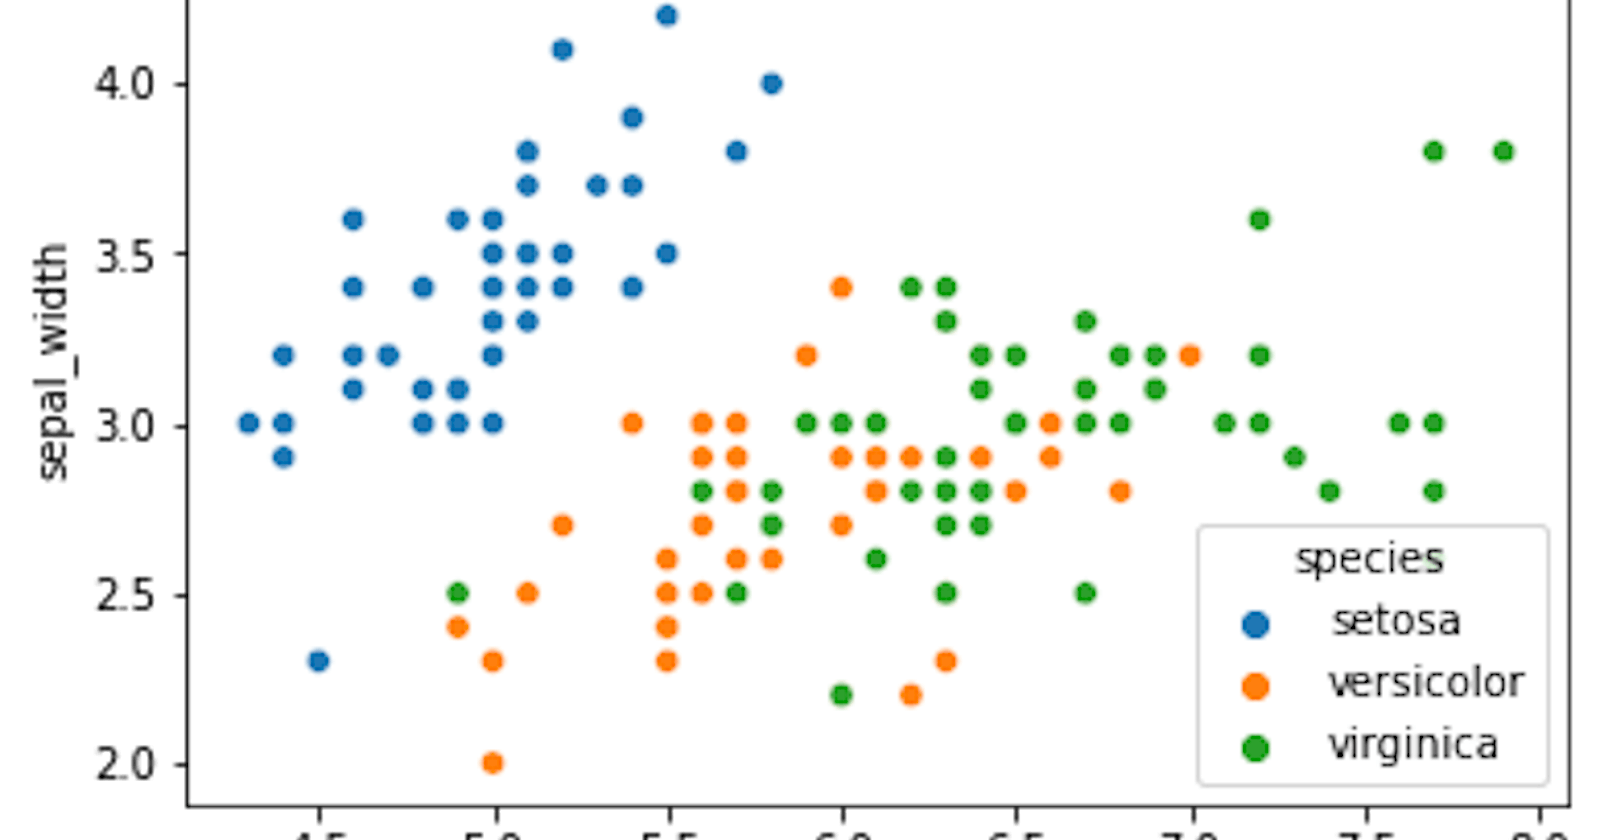
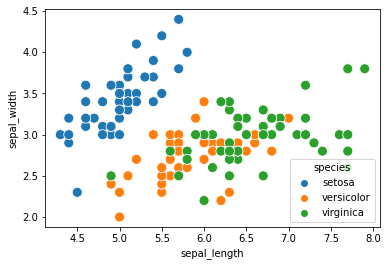
There are various customisations available in Seaborn like this.Like if we need to increase the size of the points , we can do that by using the “s” parameter.
sns.scatterplot(flowers.sepal_length,flowers.sepal_width,hue=flowers.species,s=100);
The above code will give the same plot with a big size of markers
Seaborn operates in top of MATPLOTLIB just like Pandas operates in top of Numpy for its numerical operations.
So we can include MATPLOTLIB functions while using the seaborn on same cell.
plt.figure(figsize=(20,10))
sns.scatterplot(flowers.sepal_length,flowers.sepal_width,hue=flowers.species,s=100);
If we use the above code,it will give a big scatterplot